What Is «ROI (Return On Investment)»?: 2 Ways to Calculate It – Simple and Precise
ROI shows whether an investment paid off. In marketing, teams often calculate it too simply — they take revenue and forget margin, salaries, agency costs, and repeat sales. We break down the 2 ways to calculate it and the differences between ROI, ROMI, and ROAS in 2026.
In short: ROI (Return On Investment) is the return on investment ratio. The basic formula is ROI = (revenue − costs) / costs × 100%. If you get more than 100%, the investment pays off; less than that and you are in the red. For marketing, ROI alone is not enough — also track ROMI, ROAS, CAC, LTV, and payback.
ROI, or the return on investment ratio, is a metric as important as LTV (customer lifetime value — the total profit from a single customer) or CAC (customer acquisition cost — the cost of acquiring a customer).
In this article, we explain why. It is everywhere — from real estate deals to events. But it is not all that obvious. If the metric reflects the efficiency of your spending, why do marketers need so many other reports? How do you collect all the data manually once the business has grown? And how do you cope in times of uncertainty?
You need to learn how to analyze.
Recent years have shown how important it is to analyze business processes. Companies increasingly think about how to optimize their internal operations and track the flow of money. No analytics — no coordinated work.

Где все клиенты? Там – где есть трафик. Хочешь, SEOquick привлечет его тебе?
Контекстная реклама – быстрый способ получить клиентов на свой сайт здесь и сейчас.
Давай мы за тебя настроим кампании на Google AdWords релевантно бизнесу.
А ты будешь платить только за те показы и клики, которые приведут целевую аудиторию на сайт.
Only 20% of managers at traditional corporations are satisfied with the efficiency of their departments. The same study found that most of them invested strategically in marketing, technology, and structures to capitalize on new growth opportunities.
At the same time, interest in end-to-end analytics and CRM keeps growing: businesses want to see which channel actually brings in money. And that makes sense — according to 2025 industry research, around 63% of marketers still cannot prove the ROI of their campaigns, and last-click attribution misallocates up to 40% of the credit across channels.
To cut or reallocate budgets wisely, you need to understand what you can give up. Which means analyzing. This is especially true for small businesses: it is better to turn off unprofitable ads than to cut payroll.
Every entrepreneur wants to know how effective their spending is, especially when it comes to advertising. ROI is the very metric that gives a clear answer about whether investing in a project makes sense. If there is a formula that answers a "yes or no" question, it is ROI.
The essentials:
- suitable for small businesses;
- a simple "5th-grade" formula;
- does not take much time to calculate;
- if you only calculate ROI, you do not need extra tools;
- free.
ROI is one of the most controversial metrics. Some find it extremely convenient and love it for its simplicity, considering it effective. Others argue that the return on investment ratio alone is not enough: the data is easy to manipulate, so the metric cannot be considered objective.
The truth, as usual, is somewhere in between. Even a good tool is useless in unskilled hands. And the human factor is present everywhere — except in automation. We will talk about that today too.
What ROI Is: Definition, Formula, and Ratio
Already ready to calculate the efficiency of your project? Not so fast. Let us quickly run through the terms: the simple formula, the complex formula, what ROI is unprofitable, and the pros and cons.
What is it?
ROI is the return on investment ratio in general, from the English term Return On Investment. It is a calculation of the benefit a project will gain from an investment. The metric is expressed as a percentage.
The standard formula?
Calculating the metric is the simplest math. That is exactly why people love ROI.
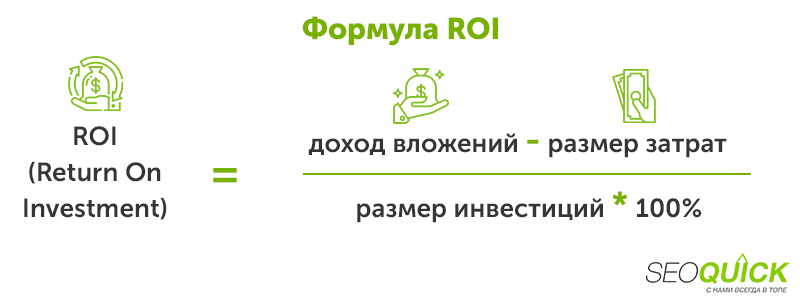
In this formula, revenue is the existing profit from sales. The cost is the money we spend to generate that revenue. The investment is what we put in: a marketing budget or the money spent to buy the business. The result comes out as a percentage.
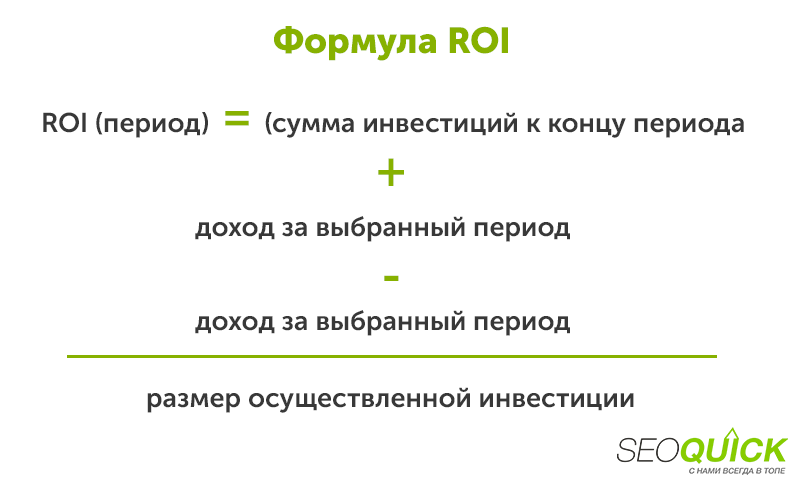
Important: ROI is the difference between costs and revenue. If one figure rises or falls, the whole formula changes. This is not the only option. There is a more complex version for economists that factors in cost of goods, depreciation, and the cost of capital.
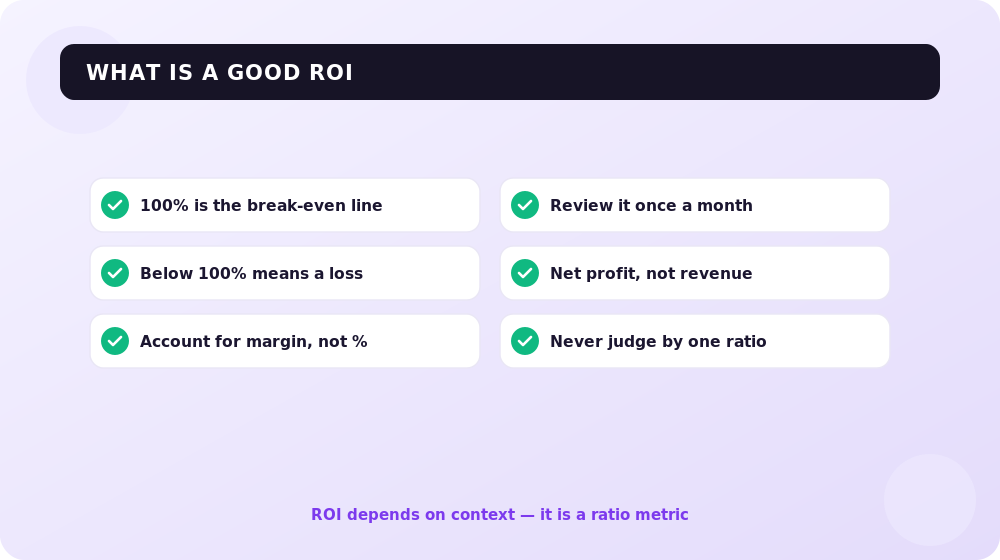
To understand efficiency, the first formula is usually enough. But it has its pitfalls. This is a metric that is entirely context-dependent — you cannot read it "in isolation." Such metrics are called ratio metrics. You can get a high ROI with a small business profit and, conversely, a low ROI with high revenue. In short: you cannot draw conclusions based on the ratio alone. Account for real revenue and costs, and most importantly — margin.
What ROI is good?
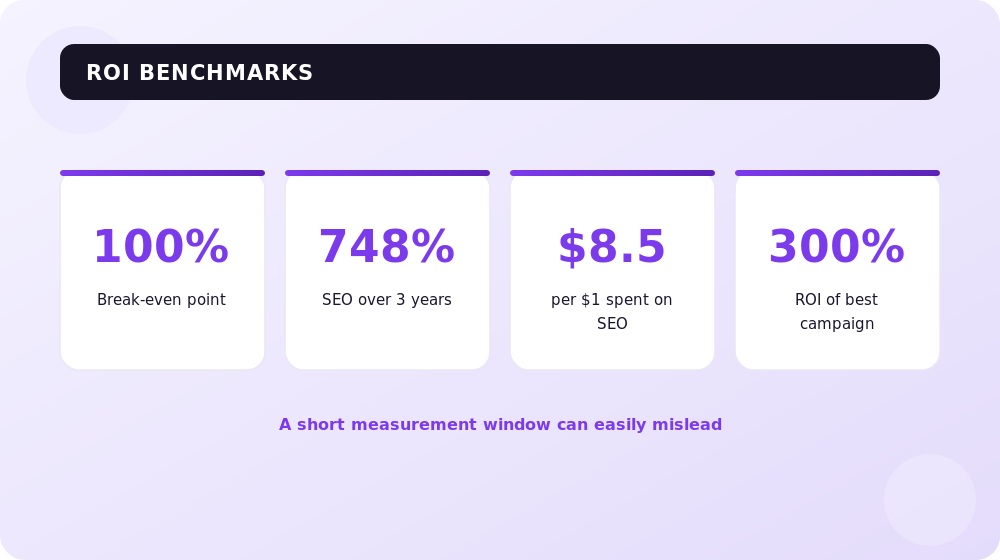
When looking at ROI, we use 100% as the baseline. If the calculation comes out above 100%, you are in the black and the investment pays off. If it is below 100%, you are in the red and something needs to change.
But a "good" ROI always depends on margin and timeframe. For example, the median ROI from SEO, according to 2021–2025 industry statistics, is about 748% over three years — roughly $8.5 for every dollar invested. But the first 6 months of SEO often deliver only 0.8x, and it only reaches 2.6x by month 12. That is why a short calculation period can easily mislead you.
The pros of calculating ROI?
- easy to calculate;
- good for quickly understanding your actions;
- provides a simple basis for comparing several growth points;
- risk factors become obvious.
There are downsides too:
- the effectiveness of the "bare" formula is still questionable;
- it accounts for far from all possible outcomes (repeat sales, delayed demand, brand effect).
If you want traffic and sales from paid search, fill out the form below or order pay-per-click advertising setup from SEOquick.
ROI, ROMI, ROAS, CRR: Explaining the Difference in 10 Seconds
There are four metrics that people constantly confuse. Errors in the definitions lead to wrong calculations. In this mini-section, we explain in 10 seconds what the difference is and how to remember it for good.
We have established that ROI is the return on all investments. But marketers use three more acronyms.
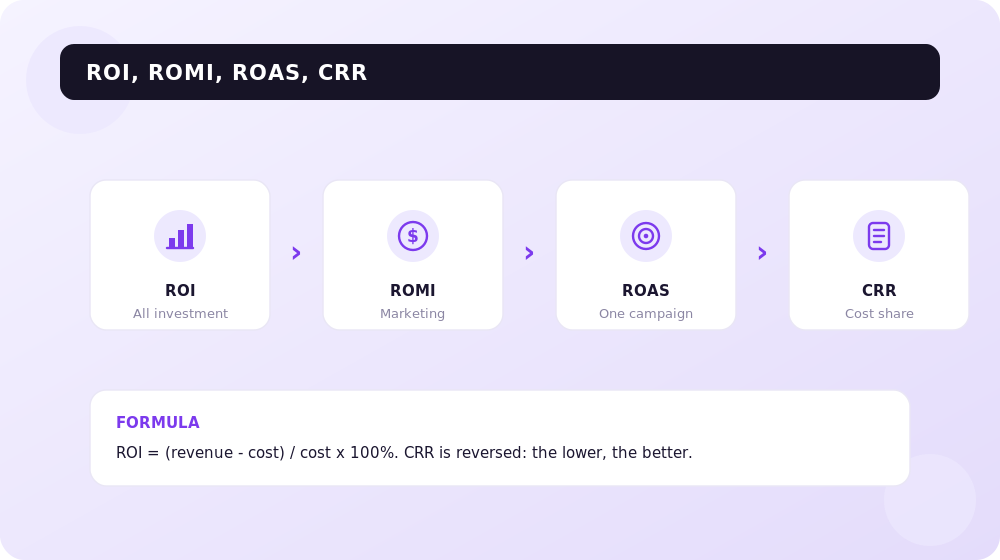
How do you keep them straight?
ROMI (Return on Marketing Investment) — here the word "marketing" is added. ROMI accounts only for the revenue and investments of marketing activities. The formula is the same: ROMI = (marketing revenue − marketing costs) / marketing costs × 100%. Often, when marketers say "ROI," they actually mean ROMI.
ROAS (Return on Ad Spend) — this is also about marketing, but for a single specific ad campaign. You launched a new product, built a landing page, paid bloggers to promote it — and you measure the result. ROAS = ad revenue / ad spend. It is usually expressed as a ratio (for example, 4:1) or as a percentage.
To put it simply:
- need to understand the efficiency of the whole project? Calculate ROI;
- invested $500,000 in marketing this month? Check the ROMI;
- launched a new product, advertised it, and now have doubts? ROAS will help.
There is also the CRR metric (Cost Revenue Ratio, also known as ad cost share) — a ratio that shows ad spend relative to revenue. That is, what percentage of earnings went to advertising. Unlike ROI and ROAS, the lower the CRR, the better. In essence, it is the flip side of ROAS: a 4:1 ROAS equals a 25% CRR.
ROI helps you calculate the payback of all investments — from the office kettle to the CRM subscription. Everything invested in the business. Determining it is simple: account for all project costs and all the revenue it generates.
The main purpose of the metric is to show how successful your investments are. The most interesting way to explore the ratio is through marketing: the money put into it and the profit from ad campaigns.
Recommended reading:
Calculating ROI. Examples in Hryvnias and Dollars
Theory is fine, but everything becomes clear with an example. You are an entrepreneur, and you need to understand how well your business pays off. You have a calculator in hand and one formula in your head.
Example 1.
You launched three ad campaigns for three products.

The initial data. Let us go through each campaign in detail.
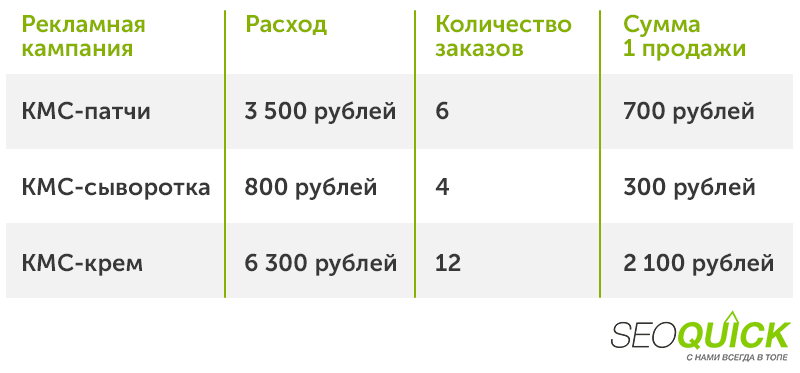
The first is a campaign for patches. You spent 3,500 UAH on advertising and managed to sell 6 items at 700 UAH each.
ROI = (6 × 700 − 3500) / 3500 × 100% = 20%
The ROI of the patches campaign is 20%. That is below 100% — the campaign is deeply unprofitable, so it is better to drop it.
Using the same approach, we calculate the ROI of the serum campaign: 800 UAH spent, 4 items sold at 300 UAH each.
ROI = (4 × 300 − 800) / 800 × 100% = 50%
The ROI is 50%. A bit better, but still below 100%, so the campaign is also unprofitable.
Finally, the cream: 6,300 UAH spent, 12 items sold at 2,100 UAH each.
ROI = (12 × 2100 − 6300) / 6300 × 100% = 300%
The ROI of the cream campaign is 300%. That is a very good result, and it makes sense to invest budget in this campaign.
How do you keep evaluating ad performance after that? You need to keep your finger on the pulse. Assess your activities at least once a month. This approach lets you turn off unprofitable channels in time and shift budget to more successful campaigns.
What to do if ROI is negative:
- increase activity on high-performing channels — this could mean expanding reach;
- reduce activity on low-performing channels or turn them off.
The metric is also affected by contractor payments, seasonality, geo, and other less obvious factors. Stay alert.
Example 2.
A bigger-picture example. You decided to acquire a business — your choice fell on a neighborhood coffee shop. The total investment is 800,000 UAH. The previous owner estimates revenue at 400,000 UAH per month. Buying coffee, milk, servicing the coffee machines, pastries, and other expenses come to 320,000 UAH per month.
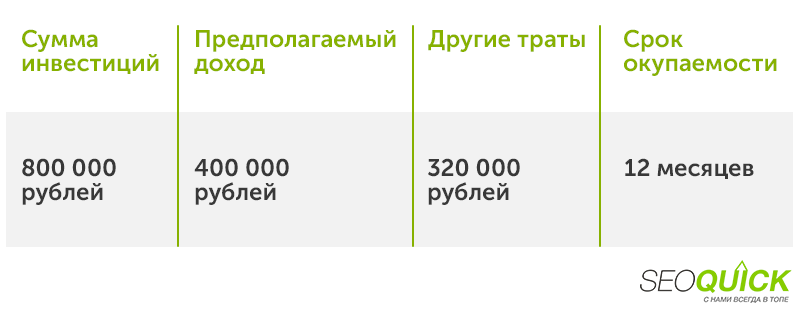
Let us figure out whether it is worth it.
(400,000 − 320,000) × 12 / 800,000 × 100% = 120%
Profitability is right on the break-even edge — just over a hundred percent. Buying is risky. It is worth taking a closer look: seasonality, the neighboring residential complex about to open, or maybe the interior is scaring customers away.
When You Should Not Calculate ROI
Already inspired and stocked up on calculators? Not so fast. Sometimes ROI can hurt rather than help. Let us figure out when you should not resort to the ratio.
Like everything in this world, the ratio cannot be considered universal. The most common example — ROI works poorly in the field of expensive services and products. This is due to the long purchase chain. The customer comes to search, chooses, compares, clicks, and "gets to know" you thanks to your pay-per-click ad. Then they go to check out competitors' offers. What is more, the customer may return to you from a different ad — for example, from retargeting on the Google Display Network. And this loop can repeat.
This also affects how you assess channel performance. A customer found you through paid search, clicked the ad, but came back only a week later — the sale was not credited to the right channel, and the conclusion about efficiency turned out to be wrong. That is exactly why Google Analytics 4 (GA4) uses data-driven attribution by default, distributing credit across all touchpoints. That said, for it to "learn," you need at least 400 conversions over 30 days.
The ratio is also fairly static: values are calculated for a specific date and do not account for changes in season, time, or exchange rates.
- in short — anything unexpected is hard to factor into a manual calculation;
- in marketing, ROI and ROMI are one-sided: they only have "black" and "white." They reflect neither customer loyalty nor the effect of staff training;
- at the start of a new project, when costs exceed revenue, the metric will be negative and can mislead you. It is simple — you are investing in growth, and the returns will come later.
If your business has many such nuances, manual calculation is not for you.
How Marketers Deceive You
Your business has grown. Now you have a marketer, and they promise to answer for the numbers with their head. What is the catch? We explain why you should not award a bonus just for a pretty ROI.
In the new employee's report there is a proud line: "Return on investment ratio — 160%." Meanwhile, the cost per click (CPC) is only 6 UAH. The ads were visible everywhere, there were clicks, and seemingly a couple of sales.
When you find yourself in this situation, do not be lazy — recalculate based on real revenue and investment. Otherwise it is unclear where the figures came from and what was divided by what. It is not hard: suppose the ad investment was just 1 UAH — the minimum value (we do not divide by zero). Plug it into the formula — and you get a laughable "revenue" of 2.6 UAH.
Be vigilant. Pretty numbers and percentages do not mean the business is doing well. It is always better to look at real results — and be sure to look at net profit, not revenue.
What Methods of Calculation Exist
Why do some account for every hryvnia while others lose hundreds of thousands? The calculation can lead to wrong conclusions. What do you do if you do not have time to calculate? What is better — calculating it yourself or automating it? Let us read on.
To calculate the ratio, we recommend collecting data for at least a month. The main problem for marketers (and not only them) is ignoring metrics. More metrics — a more accurate calculation — a more correct conclusion. There are two ways to do this.
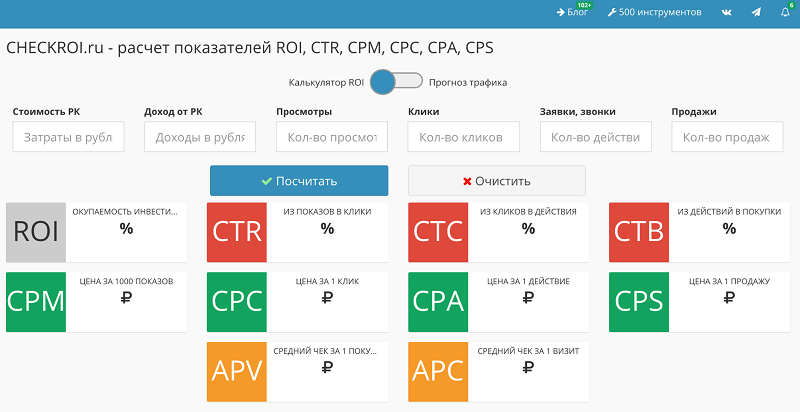
Method 1. Do it yourself
We gave an example of calculating ROI by hand above. This method has one significant downside — the human factor. An employee, just like you, can make a mistake, even when calculating in Excel or Google Sheets. It is worse if the metric is deliberately miscalculated — to inflate the results of their own work. So if an employee's bonus is tied to ROI, learn to calculate it yourself. It is not hard: in any online ROI calculator, you simply plug in the available data. It is free, online, and fast.
Manual work takes time and energy. That is exactly why automation exists.
Method 2. Automatically
You can calculate return on investment simply and for free in various calculators — any search engine returns them for a similar query. There are options for every taste.
A more complex but more effective path is end-to-end analytics systems. They have everything a marketer needs, and the human factor is eliminated: everything is calculated automatically. Let us look closer.
Why Bother With Complex Tools If the Formula Is So Simple
What is end-to-end analytics — as simply as possible. I do not need it. Or do I? Let us figure out which data you can calculate with the formula and how to do it.
An end-to-end analytics system can calculate almost any marketing metric. It is a service that combines data from your website, ad platforms, and CRM. So you have a CRM, call tracking, and a Google Sheets spreadsheet — all of it "flows" into end-to-end analytics, and you track metrics across every channel.
It calculates automatically, of course. Since the human factor is eliminated and data is collected without interruption, everything is objective. ROI is calculated automatically based on the collected statistics: you simply plug in the data you need. Services even write: "a full sales funnel from ad impressions to ROI."
This is the case where ROI can and should be calculated in both large and small businesses. The system collects everything for you. As an example, calculating spend on Google Ads: everything is computed automatically from budget to deal value.
The downside — the more data, the more accurate the calculation. If the business has not yet accumulated a base, small volumes are easier to calculate yourself. But if you already have an ecosystem of tools, you can implement automation: this frees you from the routine and gives you ready-made reports right away.
Benchmarks: What ROI and ROAS Are Considered Normal in 2026
To understand whether your result is good or not, it helps to know the market benchmarks.
- The average e-commerce ROAS in 2025 dropped to roughly 2.87:1 — about minus 4% year over year due to rising competition and traffic costs.
- A "good" ROAS for e-commerce in 2026 is considered roughly 3–4:1 and above. High-intent Google Ads search campaigns average around 5:1.
- But it all comes down to margin. If your margin is 30%, you need a ROAS of at least 3.3:1 just to break even on ads — otherwise you are paying for sales out of your own profit.
- SEO unfolds over the long run: the first 6 months ROI is often around 0.8x, by month 12 around 2.6x, and the 3-year median reaches hundreds of percent.
The takeaway is simple: a "good" ROI is always tied to your margin, industry, and planning horizon. Compare yourself not against abstract numbers, but against your own break-even point.
FAQ: Common Questions About ROI, ROMI, and ROAS
What is the simplest ROI formula?
ROI = (revenue − costs) / costs × 100%. If the result is above 100%, the investment pays off; below that and you are in the red. For marketing, instead of total revenue it is better to use net profit (accounting for margin).
How does ROI differ from ROMI?
ROI measures the payback of all investments in the business, while ROMI (Return on Marketing Investment) covers only marketing investments. The formula is the same; only the set of costs and revenue taken into account differs.
What is the difference between ROMI and ROAS?
ROMI assesses the efficiency of all marketing, while ROAS (Return on Ad Spend) measures the return of a specific ad campaign: ad revenue / ad spend. ROAS does not account for salaries, agency fees, and other marketing costs, which is why it always looks more "optimistic" than ROMI.
What is CRR and how is it related to ROAS?
CRR (cost revenue ratio, or ad cost share) shows what percentage of revenue advertising consumed. It is the inverse of ROAS: a 4:1 ROAS corresponds to a 25% CRR. The lower the CRR, the better.
How do you calculate ROI for SEO?
SEO ROI = (revenue from organic traffic − cost of SEO) / cost of SEO × 100%. Revenue is estimated through the value of organic traffic: search volume × position CTR × conversion rate × average order value. Keep in mind that SEO does not turn a profit immediately — usually by months 6–12.
What ROAS is considered good in 2026?
There is no universal answer — it all depends on margin. A benchmark for e-commerce is 3–4:1 and above; for high-intent search campaigns, around 5:1. The main rule: your ROAS should exceed your break-even point (for a 30% margin, that is at least 3.3:1).
Conclusions
Let us sum up briefly. ROI is a necessary metric. Because of its simplicity, many consider it unserious, but that is not the case: you can build entire analyses on the return on investment ratio. The key question is how much data you account for. The more, the more accurate the result.
It is believed that the ratio is not suitable for large businesses: many nuances that are hard to account for affect its accuracy — exchange rates, staff training costs, the length of the deal. The longer a customer "wanders" around the internet, the harder it is to identify the source, and an effective channel may not show up in your reports. So connect your CRM with analytics and use attribution models in GA4.
There are two ways to calculate ROI — manual and automatic. The manual one works for quick analysis and small businesses; the automatic one is for large businesses where you cannot track all the data yourself. Only automation can ensure the objectivity of ROI — otherwise the human factor affects the result.
Now you can weigh all the pros and cons and decide whether you need to calculate return on investment — and which specific metric from the ROI / ROMI / ROAS trio fits your task.

Link Building in Simple Words: Where to Get Permanent Links and How to Promote a Site with Links in 2026
Link building in simple words from a practitioner since 2008: how permanent links differ from rented links, why the black-hat SEO era is over, white-hat methods with examples, internal linking, AI-assisted link building, and sources.
Read →Google Ads Keywords in 2026: Research, Match Types, Negative Keywords
How Google Ads keywords actually work in 2026: real match type behavior, keyword research, campaign structure, negative keywords and PMax.
Read →Performance Max for an Online Store: A Setup and Optimization Case Study
How to set up Performance Max for an online store: a case study with ROAS growth from 2.8 to 5.1, the Merchant Center feed, asset groups, budget and optimization.
Read →Want to apply this to your site?
We will review the current situation, find the first growth levers, and suggest a practical working format.